
Empowering Humanitarian Crisis Response with Tableau
Humanitarian organizations play a vital role in responding to crises around the world, providing essential aid to those affected by natural disasters, conflict, and other emergencies. In order to effectively respond to these crises, it is important that organizations have access to timely, accurate, and actionable data. This data can help organizations understand the scope and impact of a crisis, target aid to those in need, and track progress over time.
One powerful tool for analyzing and visualizing data is Tableau, a tool that allows users to quickly and easily create interactive dashboards, reports, and other visualizations. With several methods available to feed existing Salesforce data into a Tableau dashboard, organizations can harness the power of their database by creating actionable data visualizations. Below, we'll explore how humanitarian organizations can use Tableau to respond to crises.
1. Monitor the situation in real-time
In the early stages of a crisis, it is important for organizations to have access to real-time information about what is happening on the ground. Tableau's real-time dashboards allow organizations to monitor incoming data from a variety of sources, including satellite imagery, social media, and ground reports. This information can be displayed on a map, in a chart, or in other interactive visualizations, providing a comprehensive view of the situation as it unfolds.
2. Analyze data to better understand the impact of the crisis
Once data has been collected, organizations can use Tableau to analyze it visually and gain a deeper understanding of the impact of the crisis. For example, organizations can use Tableau to analyze demographic data to identify which populations are most affected by the crisis, or to analyze economic data to understand the impact on local economies. Tableau's drag-and-drop interface makes it easy to create these visualizations, allowing organizations to quickly spot patterns and trends in the data.
3. Target aid to those in need
By using Tableau to analyze crisis data, organizations can identify which areas and populations are most in need of aid. This information can then be used to target resources to the people and communities that need it most. Tableau's mapping capabilities make it easy to create interactive maps that show the distribution of aid, the locations of displaced persons, and other key information.
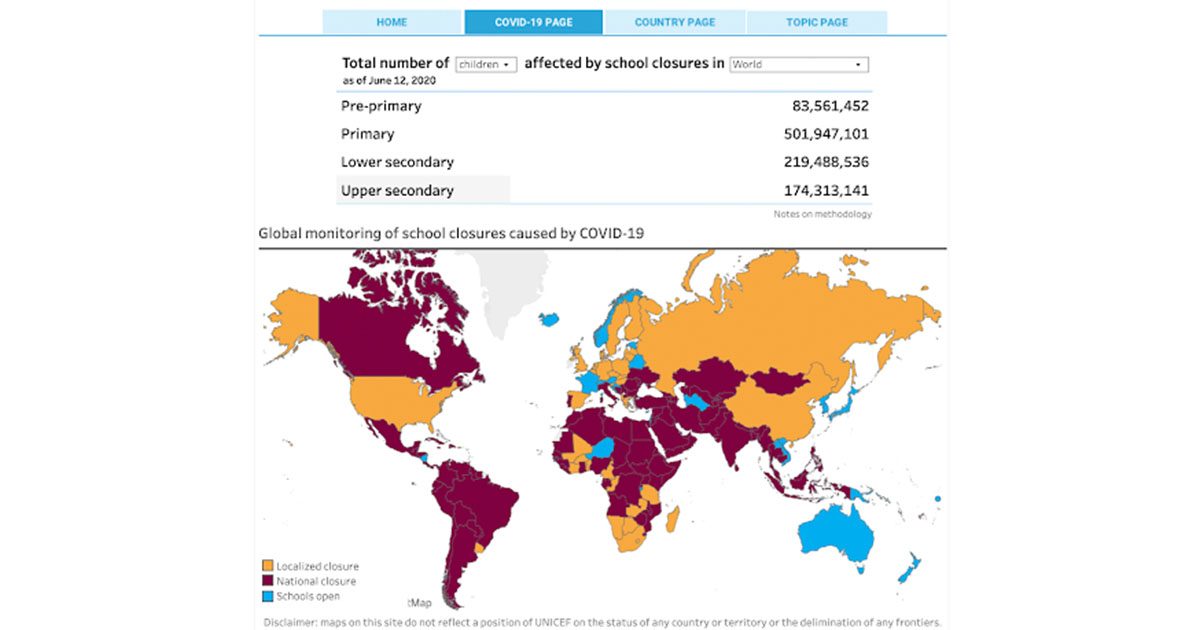
[Photo courtesy of tableau.com]
For example, humanitarian organization, UNICEF, uses Tableau to visualize COVID-19 related school closures on a global scale. This dashboard compiles 1.5 million data points on more than 200 education-related indicators, empowering decision-makers to quickly analyze large amounts of data to inform critical strategic planning.
4. Track impact over time
As a crisis response continues, it is important for organizations to track their progress and assess the impact of their efforts. Tableau's dashboards and reports can be updated in real-time, allowing organizations to track progress over time and make adjustments to their response as needed. This is especially valuable in communicating impact with stakeholders and funders.
Using Tableau with Salesforce data
Tableau has a large portfolio of tools available, one of which is native to the Salesforce platform. CRM Analytics (formerly known as Einstein Analytics), is a Tableau tool that connects data from multiple sources, creating interactive dashboards and sharing insights within Salesforce. CRM Analytics is ready to use at the click of a button - basic setup is as simple as enabling CRM Analytics and distributing licenses to existing CRM users. Beyond this initial setup, some level of data analytics skills may be necessary to integrate external data sources or configure dashboards.
Tableau is a powerful tool that can help humanitarian organizations respond to crises by providing access to real-time data, allowing organizations to analyze the impact of a crisis, target aid to those in need, and track their impact long term. By leveraging the power of data visualization, organizations can make informed decisions and have a greater impact on those affected by crises around the world. Click the button below to get in touch with our team if you’re curious what Tableau can do for you.